


Next: The Correlation between Mean
Up: Reaction Time Mean and
Previous: Reaction Time Variation as
The Poisson-Inhibition model, as well as previously developed
inhibition models, are developed to account for
the sequence of RTs which can be observed when a single test
is administrated to a single subject.
The model is designed to explain the statistical properties of a series
of reaction times,
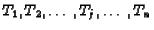 ,
representing the amounts of
time a person uses for each one of a sequence of n responses
executed consecutively. It is assumed that each response requires
the same amount of processing time: A. The actual time Tdj spent
(the reaction time), exceeds A because of distractions
interrupting work on the task. So,
Tj = A + Dj, where
,
representing the amounts of
time a person uses for each one of a sequence of n responses
executed consecutively. It is assumed that each response requires
the same amount of processing time: A. The actual time Tdj spent
(the reaction time), exceeds A because of distractions
interrupting work on the task. So,
Tj = A + Dj, where
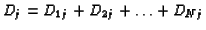 is the sum of
the distraction intervals for particular response j.
Within reaction time j, the duration of the distractions Dijare random variables and so is their number N.
In the previously mentioned Poisson-Erlang model, PE model for
short, N has a Poisson distribution and the Dij are exponentially
distributed with a constant transition rate
is the sum of
the distraction intervals for particular response j.
Within reaction time j, the duration of the distractions Dijare random variables and so is their number N.
In the previously mentioned Poisson-Erlang model, PE model for
short, N has a Poisson distribution and the Dij are exponentially
distributed with a constant transition rate  ,
so Dj has an Erlang distribution. In the Poisson-Inhibition model, PI
model for short, the hypothetical construct
inhibition, denoted by Y(t), is introduced.
Inhibition Y(t) increases
linearly with rate a1 during work intervals:
,
so Dj has an Erlang distribution. In the Poisson-Inhibition model, PI
model for short, the hypothetical construct
inhibition, denoted by Y(t), is introduced.
Inhibition Y(t) increases
linearly with rate a1 during work intervals:
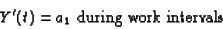 |
(1) |
and decreases linearly with rate a0 during distraction
intervals:
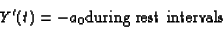 |
(2) |
The transition rates  ,
from work to rest (distraction),
and
,
from work to rest (distraction),
and  ,
from rest to work are no longer constant. From now
on they depend on
inhibition:
,
from rest to work are no longer constant. From now
on they depend on
inhibition:
 ,
,
 ,
where l1 is a non-decreasing function and l0 is
a non-increasing function.
Specification of the functions l1 and l0 leads to various
"special inhibition models".
In the PI model l1 and l0 are as follows:
,
where l1 is a non-decreasing function and l0 is
a non-increasing function.
Specification of the functions l1 and l0 leads to various
"special inhibition models".
In the PI model l1 and l0 are as follows:
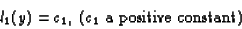 |
(3) |
The transition rate from
work to rest is constant. Since a task requires, for its completion,
an amount of working time A, and during this time,
interruptions occur with rate c1, it follows, that the number of
distractions is Poisson distributed with mean c1 A. This was the
reason for the "Poisson" in the name of the model.
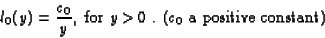 |
(4) |
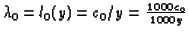
The transition rate from rest to work is given by
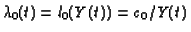 .
Note, that as Y(t) goes to zero
(during a distraction), the transition rate
.
Note, that as Y(t) goes to zero
(during a distraction), the transition rate
 goes to
infinity and this forces a transition from rest
to work before the inhibition could reach zero.
goes to
infinity and this forces a transition from rest
to work before the inhibition could reach zero.
In the case of the PE model the
inhibition has no influence on the development of the process. However,
one might as well consider it rising with rate a1 during work and
falling with rate a0 during distractions.
It seems natural to assume that as the
process goes on, the inhibition will neither increase to  or
decrease to
or
decrease to  ,
but will fluctuate around a more or
less stable mean.
Thus the mean increase of inhibition during a work
interval:
a1/c1should be equal to the mean decrease during a distraction interval:
a0/c0.
According to the PI model (Smit and van der Ven, 1995)
the parameters A, a0, a1,
c0 and c1 satisfy the equations (
,
but will fluctuate around a more or
less stable mean.
Thus the mean increase of inhibition during a work
interval:
a1/c1should be equal to the mean decrease during a distraction interval:
a0/c0.
According to the PI model (Smit and van der Ven, 1995)
the parameters A, a0, a1,
c0 and c1 satisfy the equations (![[*]](/usr/local/latex2html/icons.gif/cross_ref_motif.gif) ) through ().
According to Smit (personal communication) one might
write
a = a0, c = c0,
k = a1/a0 = c1/c0.
This is a nice way to reduce the number of parameters by one:
A, a, c and k instead of A, a0, a1, c0, c1.
No generality is
lost by this reduction. For example, suppose one applies a linear scale
transformation to inhibition. Say one measures inhibition in J (Joule)
instead of in KJ (Kilo Joules). This would change a0 and a1 by a
factor 1000 (ai becomes 1000ai) and also the numerical
values of Y (inhibition)
would be multiplied by 1000 and hence, since the transition rate
) through ().
According to Smit (personal communication) one might
write
a = a0, c = c0,
k = a1/a0 = c1/c0.
This is a nice way to reduce the number of parameters by one:
A, a, c and k instead of A, a0, a1, c0, c1.
No generality is
lost by this reduction. For example, suppose one applies a linear scale
transformation to inhibition. Say one measures inhibition in J (Joule)
instead of in KJ (Kilo Joules). This would change a0 and a1 by a
factor 1000 (ai becomes 1000ai) and also the numerical
values of Y (inhibition)
would be multiplied by 1000 and hence, since the transition rate
 has to stay the same, c0 should also be changed to 1000 c0.
Of course c1 is not affected.
So, by a scale transformation of the inhibition, one can change the
quotient
has to stay the same, c0 should also be changed to 1000 c0.
Of course c1 is not affected.
So, by a scale transformation of the inhibition, one can change the
quotient
 to any value one may desire.
Now the following result can be shown to hold.
The PI model with
parameters A, a0 =a, a1 = ka, c0 = c and
c1 = kc tends to the PE model with parameters A, c0 = c and
c1 = kc (i.e. the mean number of distractions is given by
c1A = kcA and the mean individual distraction time by
to any value one may desire.
Now the following result can be shown to hold.
The PI model with
parameters A, a0 =a, a1 = ka, c0 = c and
c1 = kc tends to the PE model with parameters A, c0 = c and
c1 = kc (i.e. the mean number of distractions is given by
c1A = kcA and the mean individual distraction time by
 )
when
)
when
 .
.
According to the Poisson-Inhibition model
the long-term trend can be described by an exponential
curve of the following form:
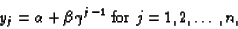 |
(5) |
where n is equal to the number of reaction times.
 ,
,
 and
and  each are functions of
the parameters A, a0, a1, c0 and c1.
In order to evaluate the stationary
mean and variance one may compute the mean and the variance of the
reaction times in the last part of the task, assuming that
the long-term trend can be neglected in that part of the test.
each are functions of
the parameters A, a0, a1, c0 and c1.
In order to evaluate the stationary
mean and variance one may compute the mean and the variance of the
reaction times in the last part of the task, assuming that
the long-term trend can be neglected in that part of the test.
Next: The Correlation between Mean
Up: Reaction Time Mean and
Previous: Reaction Time Variation as
AHGS VAN DER VEN
2002-01-14