Test
Audio latency test
The lab computer has very fast on board audio. The following image shows what happens when a pulse is sent to the serial port just before sending a bit of sound. Sounds latency is always in the 2-3 ms range. That is, it is always more than 2 ms and always less than 3 ms and it seems uniformly distributed in this range.
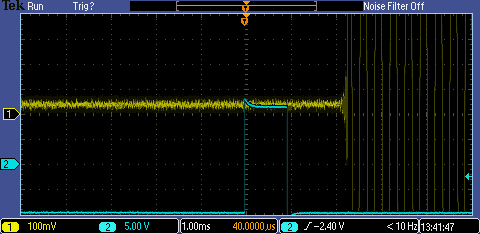
Note that this test was run using python and alsa, suing this script. Using a sound server may change things. Do not use a sounds server if latency is important for you.
Frame accuracy test
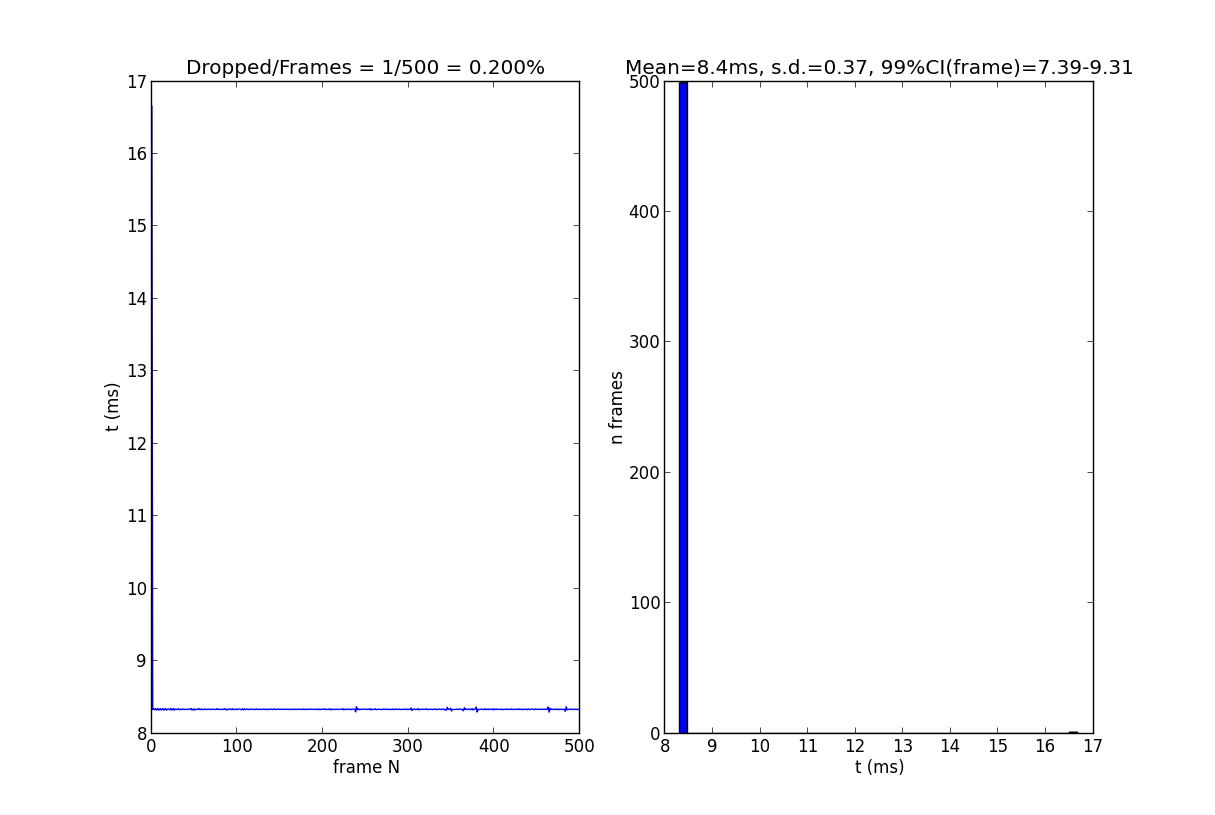
Test how accurate the time between frames is using timeByFrames.py. It is an altered version of the script of the same name that comes with PsychoPy. Much like Expyriment, it discards the results of the first 200 frames. It uses the default visual settings of the system.
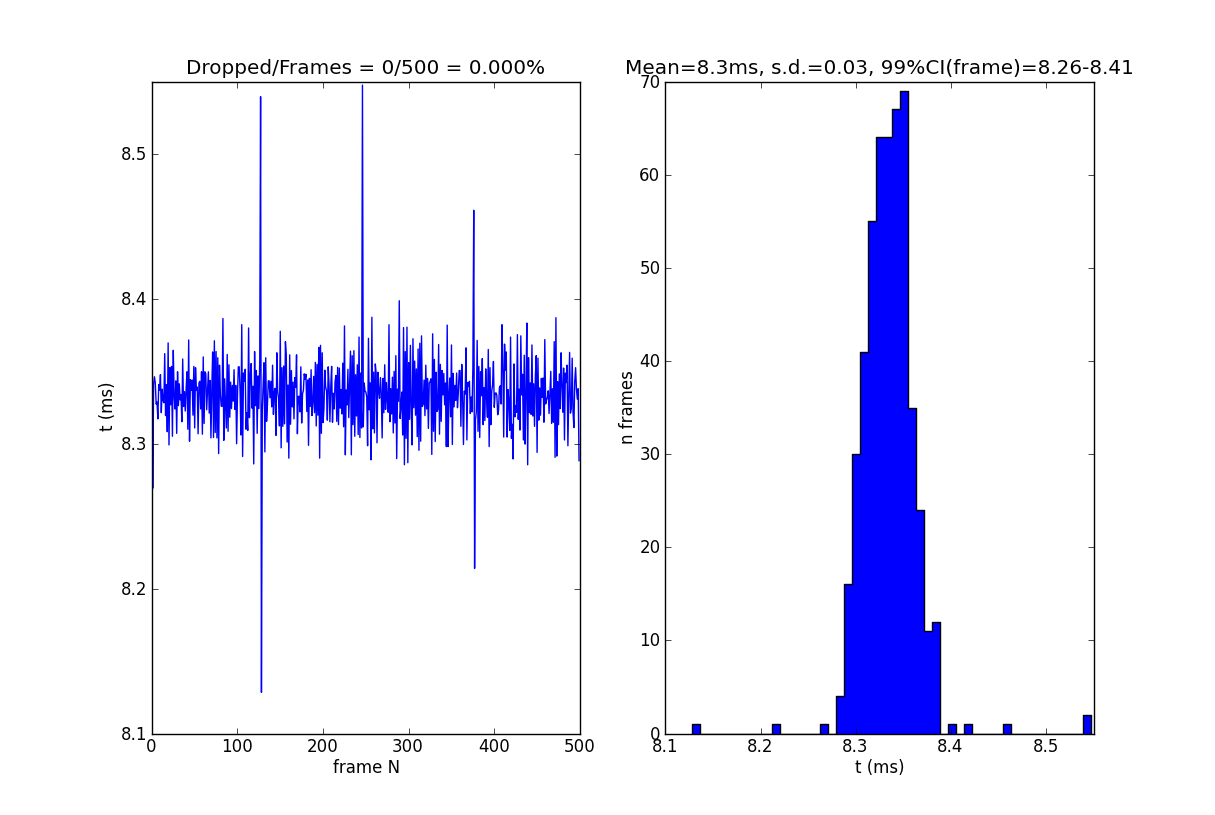
MS Windows 7
The test was run three times. One gave an outlier making the domain of the histogram very large, one gave a framedrop (1/500). The following graph shows the third run.
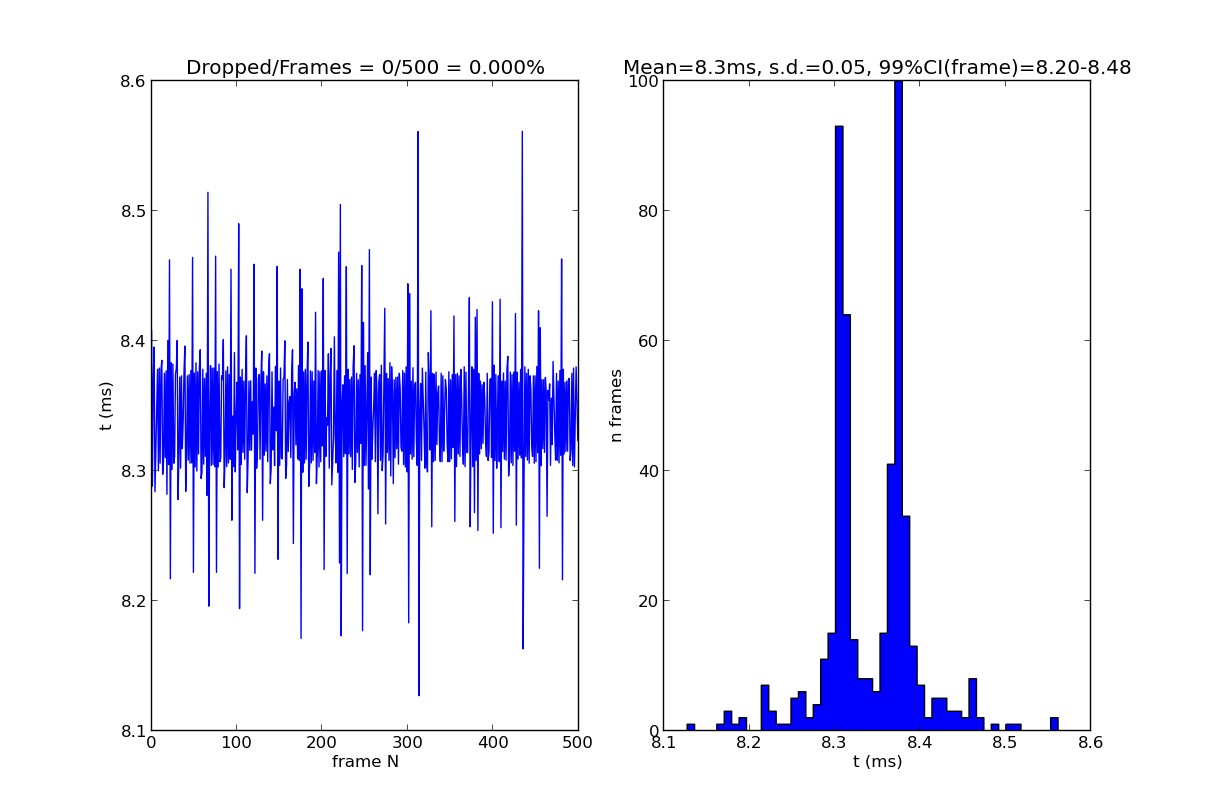
Kubuntu
Note the peculiar bipolar behaviour
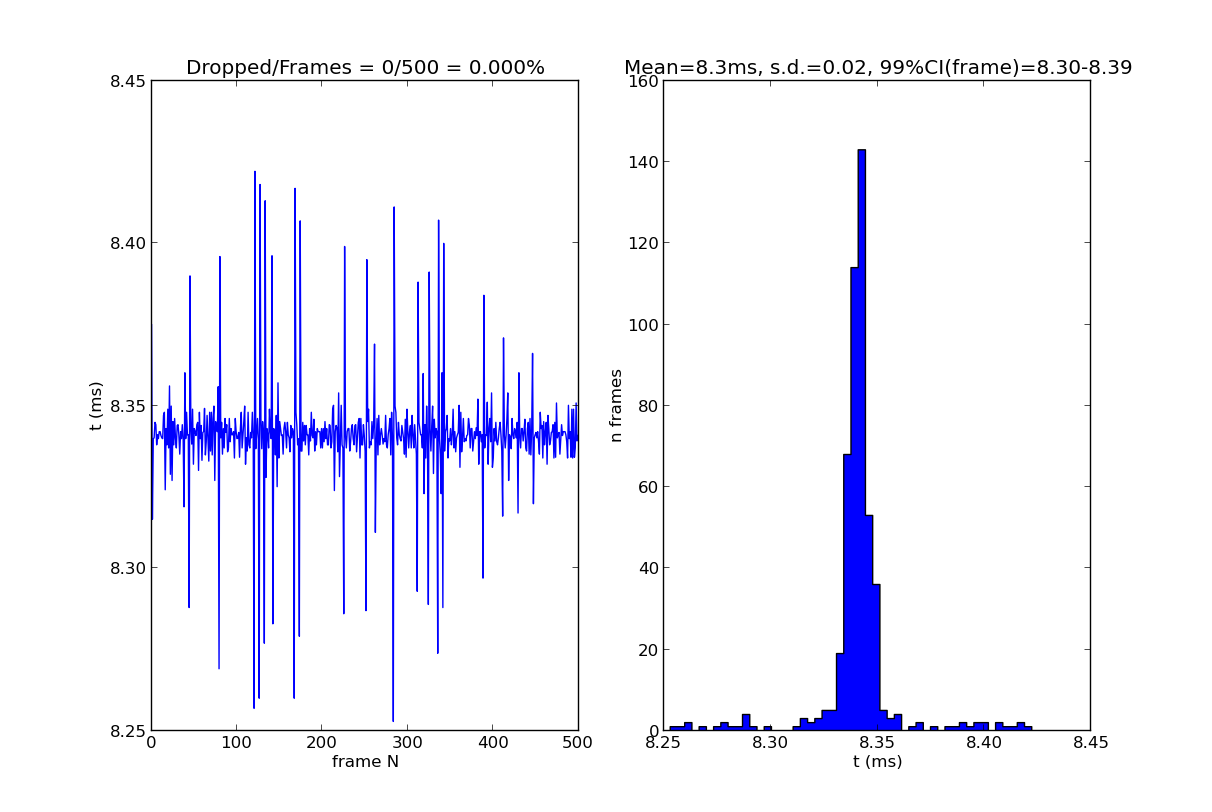
Lubuntu
Note the narrower interval.
Frame Buffer Object
Optionally PsychoPy offers a useFBO setting, which can be turned on in the experiment file, if the graphics hardware supports it. Only MS Windows seems to profit from this setting.
Conclusion
With default settings Lubuntu is best
Sensorimotorlab
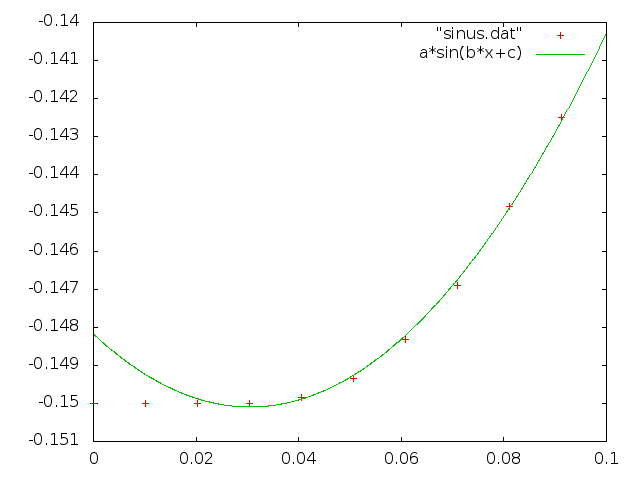
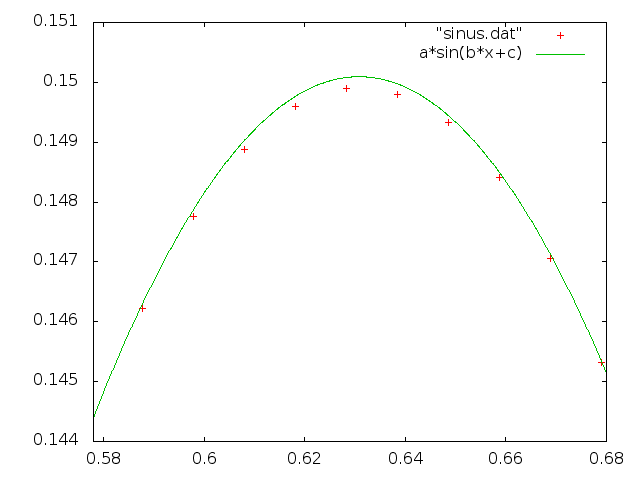
Letting the sled do a sine motion with 15 cm amplitude and 1.2 s period gives the following shape:
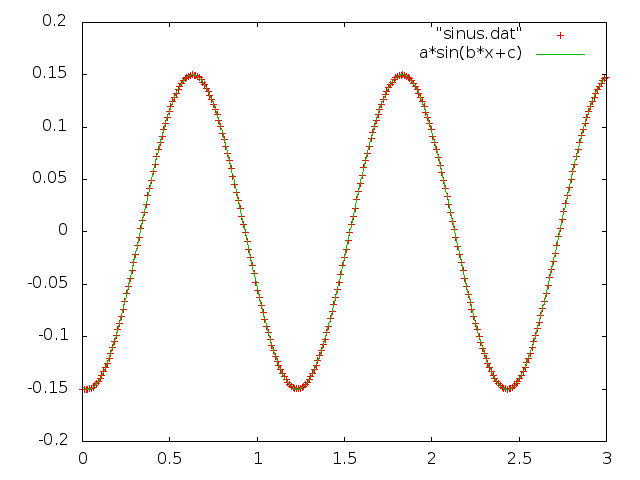
Fitting a function x = a*sin(b*t+c) to this gives.
Final set of parameters            Asymptotic Standard Error
=======================            ==========================

a               = 0.150094         +/- 1.818e-05    (0.01211%)
b               = 5.23376          +/- 0.0001421    (0.002715%)
c               = -1.7306          +/- 0.0002487    (0.01437%)


correlation matrix of the fit parameters:

               a      b      c
a               1.000
b              -0.095  1.000
c               0.082 -0.874  1.000
The values of a and b deviate about 0.5 permille from the predicted values. Note the slow and not quite sinusoidal startup and the slightly flatter than sine shape at the top: