Limesurvey, 8 Data analysis
Let's assume you activated this survey. You collected a lot of data. Now you click the responses icon  in the survey toolbar, you click Responses & statistics, you click the SPSS icon
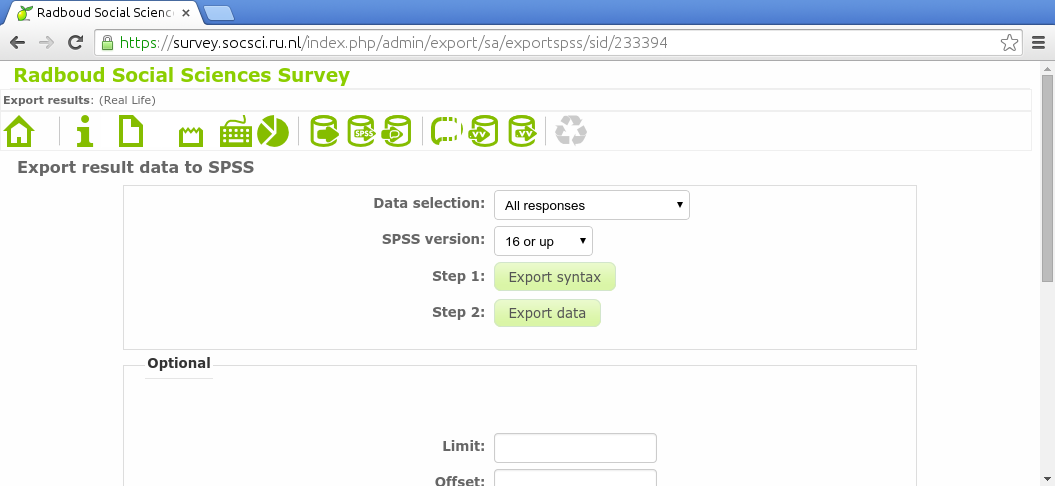
  . In the following screen you click both Export syntax and Export data.
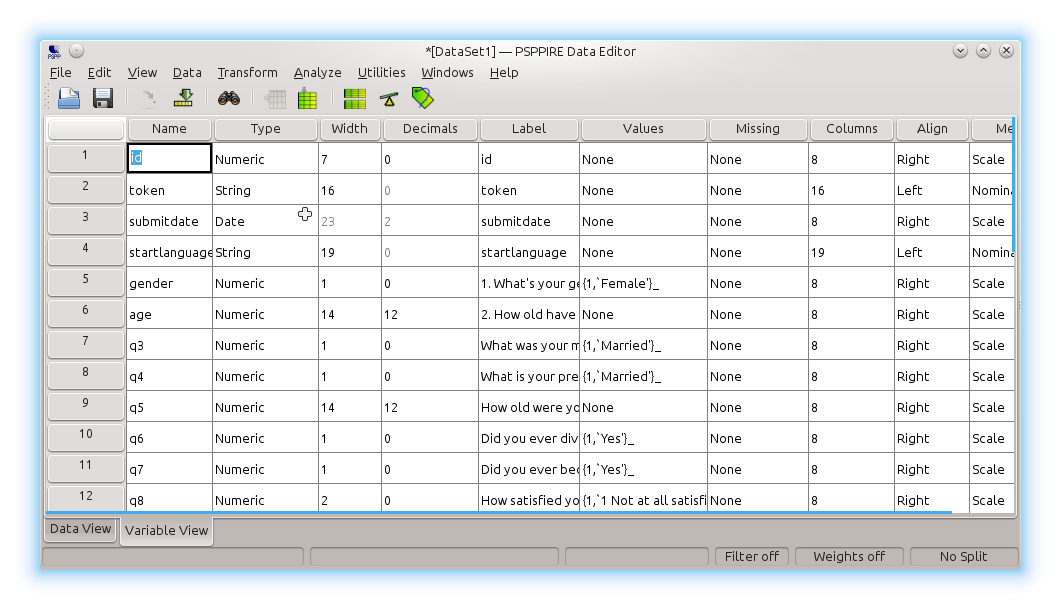
If you use this syntax file to import the data file in IBM SPSS or GNU PSPP, you will see that not only the data is nicely exported, but the entire codebook is correctly exported as well:
Here are an example syntax file and data file. Make sure you alter the data file name in the syntax file before executing it. This is only necessary in SPSS. PSPP will understand it right away.
Can you find the average age of the participants? The number of married participants? The average difference and average deviation from average of the current age and the age when marrying? What is the correlation between questions How satisfied you are with your marriage at present? and How you would describe your marriage?
Others
GNU PSPP and IBM SPSS are not the only two software packages capable of analysing our data. GNU R and Python Pandas are two other popular options. They cannot read the codebook created by Limesurvey, but they can analyze your data just as well. Try loading your data in one of them and getting the numbers asked above. This is what would give you the solution in Python Pandas:
import pandas as pd

d = pd.read_csv("survey.csv", usecols = range(4, 13), quotechar="'",
	names = ['gender','age','status5','status','age2','divorce','widow','satisfied','unhappy'])
d.age.mean()
(d.status==1).sum()
(d.age-d.age2).mean()
(d.age-d.age2).std()
d.satisfied.corr(d.unhappy)
This is what would give you the solution in GNU R:
d <- read.csv("survey.csv", head=FALSE, quote="'")
colnames(d) <- c('','','','', 'gender','age','status5','status','age2','divorce','widow','satisfied','unhappy')
mean(d[,'age'])
sum(d[,'status']==1)
mean(d[,'age']-d[,'age2'], na.rm=TRUE)
sd(d[,'age']-d[,'age2'], na.rm=TRUE)
cor(d[,'satisfied'], d[,'unhappy'], use='complete')
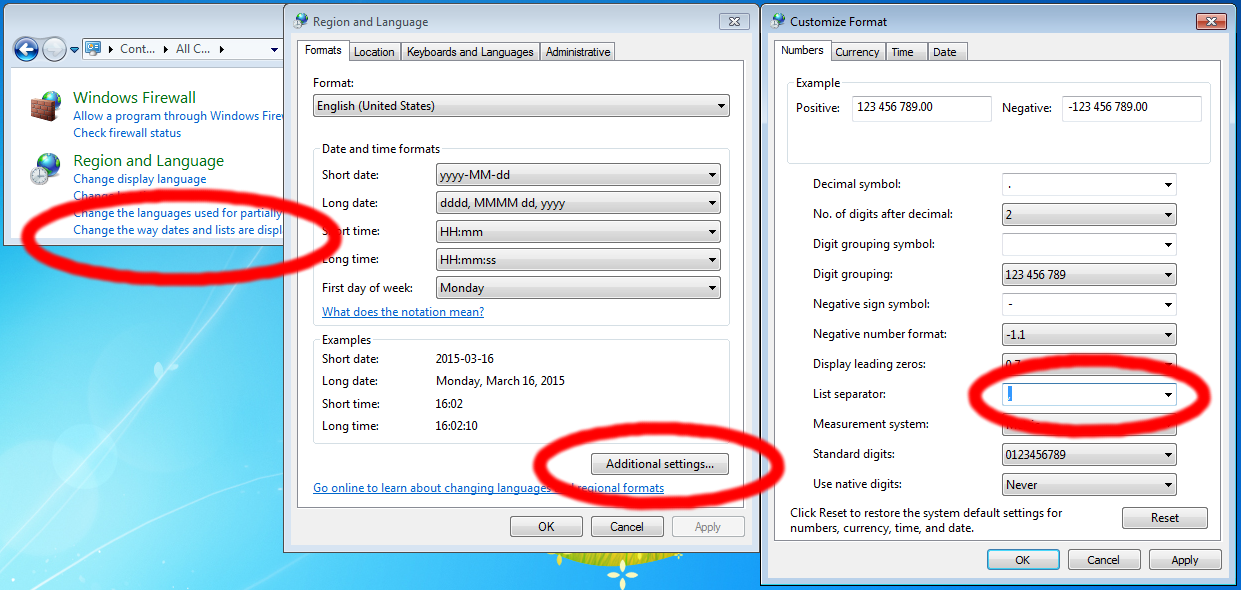
If you want to import the data in MS Excel, you must set the list separator to comma. In Europe its default setting is semicolon:
That was the last lesson of this beginner tutorial. There are some additional unordered lessons which you can access from the menu bar on the left.